Process simulation imaging
![]()
Dashboard
The Process imaging command opens the dashboard that controls the rendering of the process simulation object.
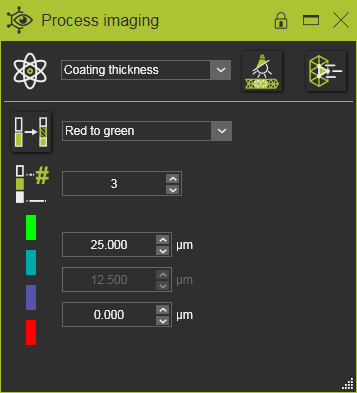
The process simulation object is in a way a special element. It does not have a simple rendering like regular elements such as geometry. Because the object reflects the result of the physical parameters of (different) process simulations, its rendering has to be a dynamic. The dashboard is the control engine of this rendering.
Physical parameter

This block shows what physical parameter currently is being displayed on the process simulation object. From the drop down list the required parameter for analyzing can be picked.
Color schemes
In this block can be specified how the rendering of the process simulation is done for the above selected parameter.

The imaging color scheme that has to be applied can be selected from the drop down list of available schemes. The scheme is then shown in the dashboard.
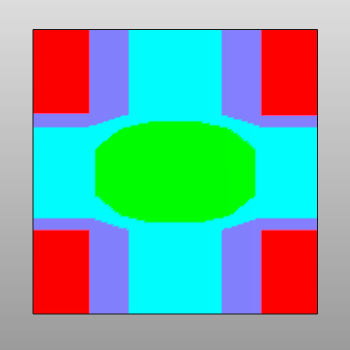
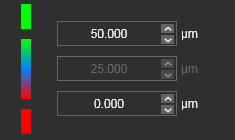
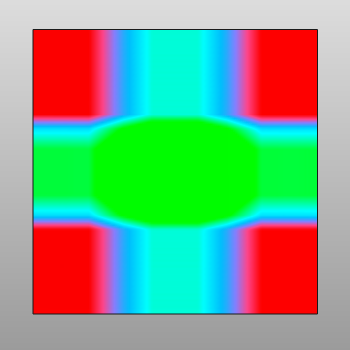
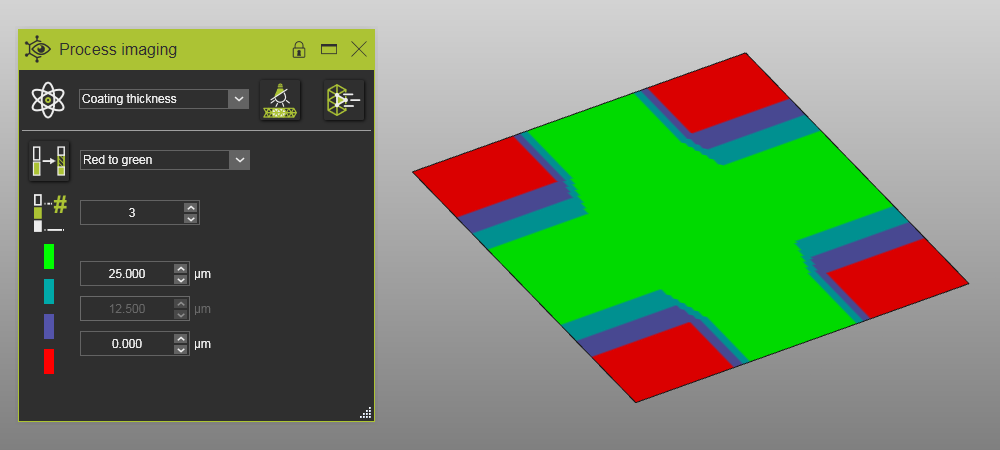
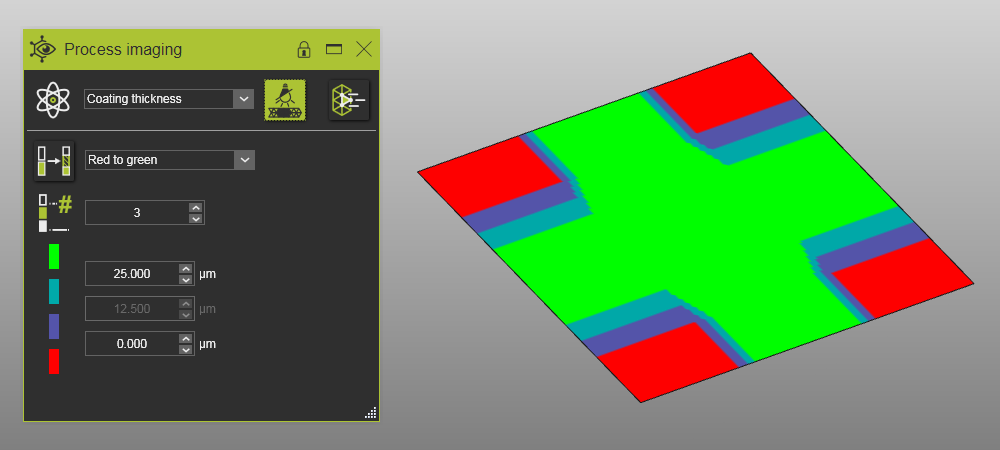
The button in front of the color scheme selector is a switch button to toggle the render mode of the scheme. It switches the rendering between fixed threshold colors (button not pressed) and a smooth gradient transition between the colors of the scheme (button pressed). The example below shows the difference.
 |   | |
 |  |
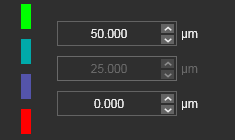
The color range limits are supported with editable fields to define the minimum and maximum values of the physical parameter that are assigned to these colors. Automatically any other intermediate color within the scheme is assigned to a value range. All values less than the minimum will be rendered with the same color as the range minimum and all values larger than the maximum will be rendered with the same color as the range maximum.

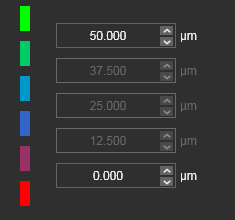
With this number, the amount of thresholds in the color scheme can be defined, with the minimum of two. Each additional threshold represents the interpolated percentage of the global value range, like in the example below. In the gradient rendering, the colors will correspond with a linear interpolated percentage of the value range between the limits of the gradient colors.
Coverage imaging
As an exception to the above, the physical parameter Coverage shows another content. Here is displayed the actual device, i.e. the robot or machine, the gun or the brush that has covered the process simulation object during simulation. And in case multiple devices are in use, it shows, obviously, the last one that has been in contact.
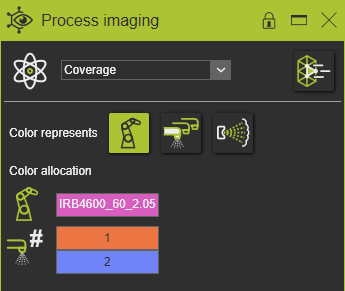
The first row defines which device type, i.e. device level, is being displayed.
| Device type | Description |
|---|---|
| Displays the coverage by the operating robots or machines. | |
| Displays the coverage by the operating guns that are defined on the tools. | |
| Displays the coverage by the processing brushes on the guns. |
Pressing the device button will switch the imaging on the PSO to that device type.
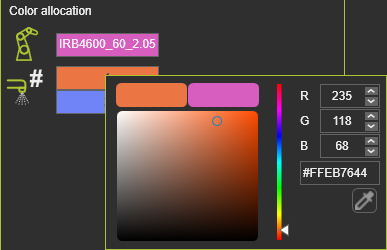
The processing and imaging color of the brushes are defined in the controller process tables. The imaging colors for the other devices can be allocated here. Picking the name field of the device will open the color picker to modify the desired coverage representation color.
Rendering
![]()
Rendering uses light sources and shading effects to give the (geometrical) objects a certain 3D realistic impression. The combination of this rendering with the 3D manipulation (pan, rotate and zoom) may cause the process simulation to be displayed in (slightly) different colors than what has been defined in the color scheme. Although this is a purely visual effect on screen, it might be misleading when interpreting the results.
Illuminated rendering is a feature that ignores these 3D rendering effects on the process simulation geometry. Pressing the option button will switch the illuminated rendering on or off.
 |  | |
| Disabled illuminated rendering | Enabled illuminated rendering |
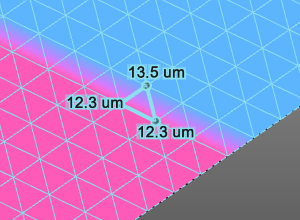
Value display
![]()
This option enables the detail analysis of the physical parameter on the process simulation object. Pressing the switch button actives its functionality. Then hovering the mouse over the object will show the local values.