Process simulation imaging
![]()
Dashboard
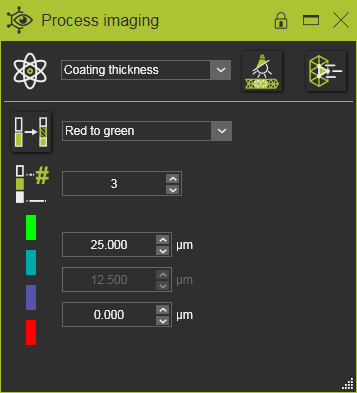
The simulation result is directly visualized on the PSO. The Process imaging dashboard offers several post-processing tools to display the simulation result in a preferred manner to be able to analyze it.
Physical parameter

From the drop down list one can pick the physical parameter that is going to be displayed. Only one parameter can be displayed on the PSO at the same time.
The content of the list of physical parameters that can be displayed depends on the active process model that is simulated.
| Physical parameter | Description | Available in process model | |
|---|---|---|---|
| Coverage | Displays which resource (robot/machine), gun or brush is operating. When multiple devices are active, only the last effective device is being shown. | All process models | |
| Coverage time | Displays the contact time of the process model at the simulated object. | All process models | |
| Coating thickness | Displays the thickness of the sprayed material on the simulated object. | Spray deposition | |
| Real color | Displays the real color of the simulated object after spraying. | Spray deposition |
Color schemes
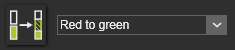
The imaging color scheme that one wants to have applied can be selected from the drop down list of available schemes.
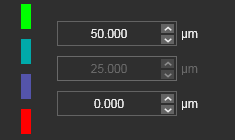
Each parameter can be displayed in another color scheme. Obviously, the value range will be different for each parameter. The display of each individual parameter, i.e. the color scheme, the number of thresholds and the value range, is being kept and will be stored in the workpiece document. Because of that the color scheme does not need to be exported with the document when opening it on another workstation.
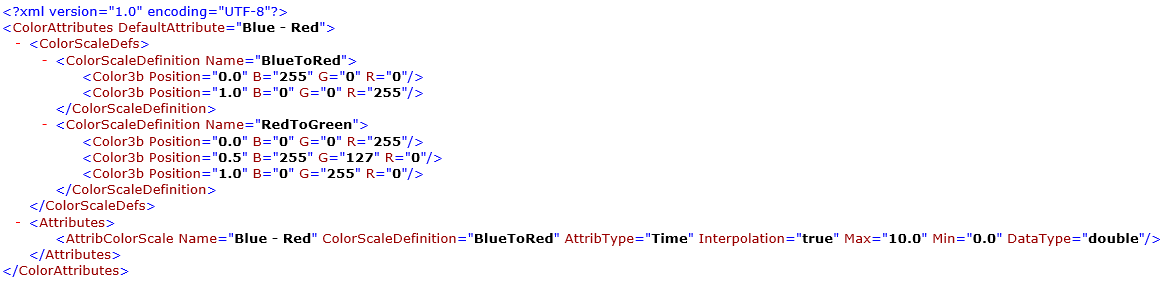
Color schemes are loaded at startup of the application. The definition file ColorAttributes.xml is user specific and is located in %LOCALAPPDATA%\CENIT\FastSuite.
| Attribute | Description | Remark |
|---|---|---|
| DefaultAttribute | Name of the default displayed color scheme at start up. | |
| ColorScaleDefinition | ||
| Name | Name of the color scheme definition. | |
| Color3b | RGB value of the color at a certain position in the range. | Colors can be defined at positions in the range between 0.0 and 1.0. Between the positions, the color will be interpolated. A minimum of 2 color positions is required. |
| AttribColorScale | ||
| Name | The name of the color scheme as being displayed in the dashboard. | |
| DataType | The type of the value attributes | |
| Min / Max | The values that are assigned to the 0.0 and 1.0 color positions. | |
| Interpolation | The color scheme is applied in threshold or gradient style. | False = threshold style True = gradient style |
| AttribType | The color scheme is applied to a physical parameter. | Attribute is not in use currently. |
| ColorScaleDefinition | Refers to which color scheme definition is being applied. |