Toolpath monitor
![]()
Dashboard
The Toolpath monitor shows the active program in its sequence of running. For each operation (group) all the steps, i.e. all teachable positions, are displayed with their properties, as shown in the example below.
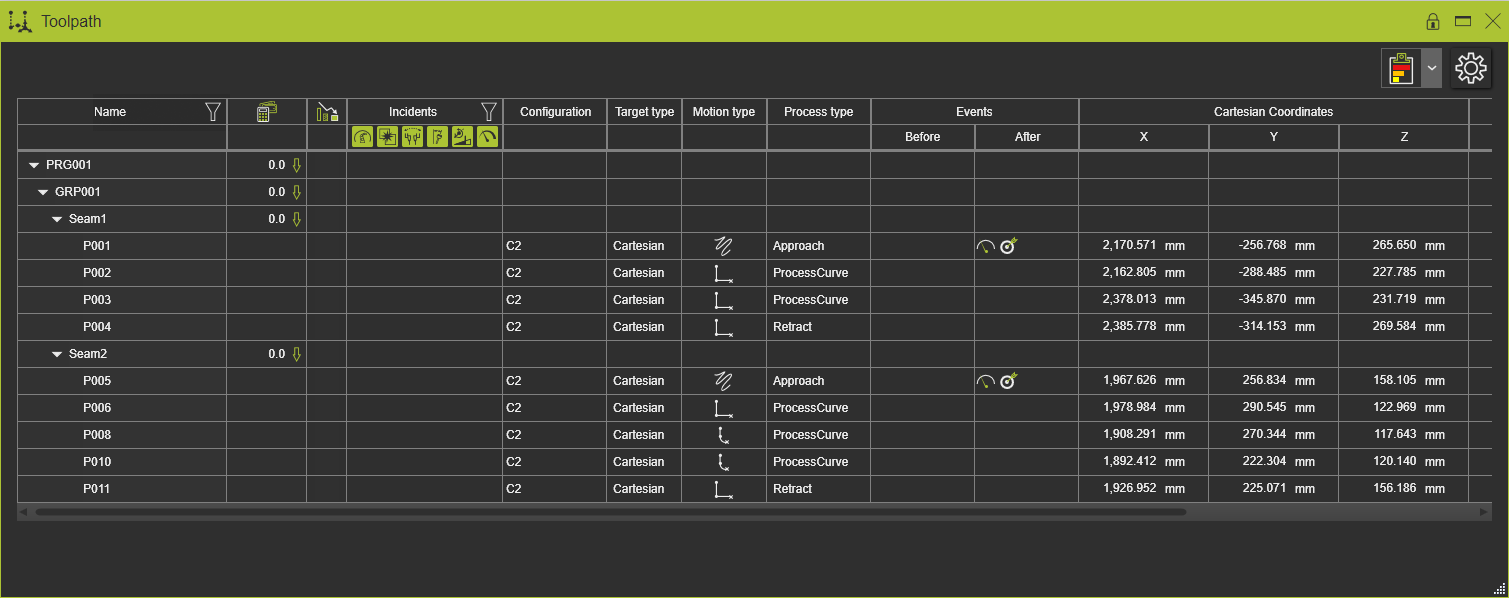
The monitor is a table with several columns.
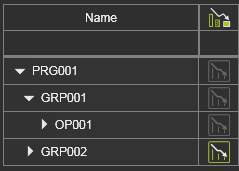
| Name | The name of the program, program call, operation group, operation or toolpath element (tag name). Each program, operation group or operation can be expanded or collapsed by clicking on the triangle marker in front of the name. |
| Evaluation costs | Value and trend indicator of the toolpath quality costs. |
| Optimization status | Status indication if the automatic optimization has been executed. |
| Incidents | Report of the toolpath quality evaluation. The toolpath quality evaluation and its reporting is described on a separate page. See this page below for a link to the toolpath quality evaluation page. |
| Configuration | The configuration of the resource at that tag position. |
| Target type | The target type for the tag position. This can be a Joint or Cartesian type. |
| Motion type | The motion of the resource for the tag position. The system supports three different motion types. |
| Process type | The process specific information of the tag position. |
| Feed rate | The feed rate with which the tool frame moves along the tool path. |
| Before and After events | Both columns show the applied events for the tag position. |
| Coordinates & rotation | Columns for the Cartesian coordinates and rotation values of a robot, the coordinates of a machine and the values of external axes. |
The dashboard supports cross highlight between the items in the table and the toolpath elements in the 3D View.
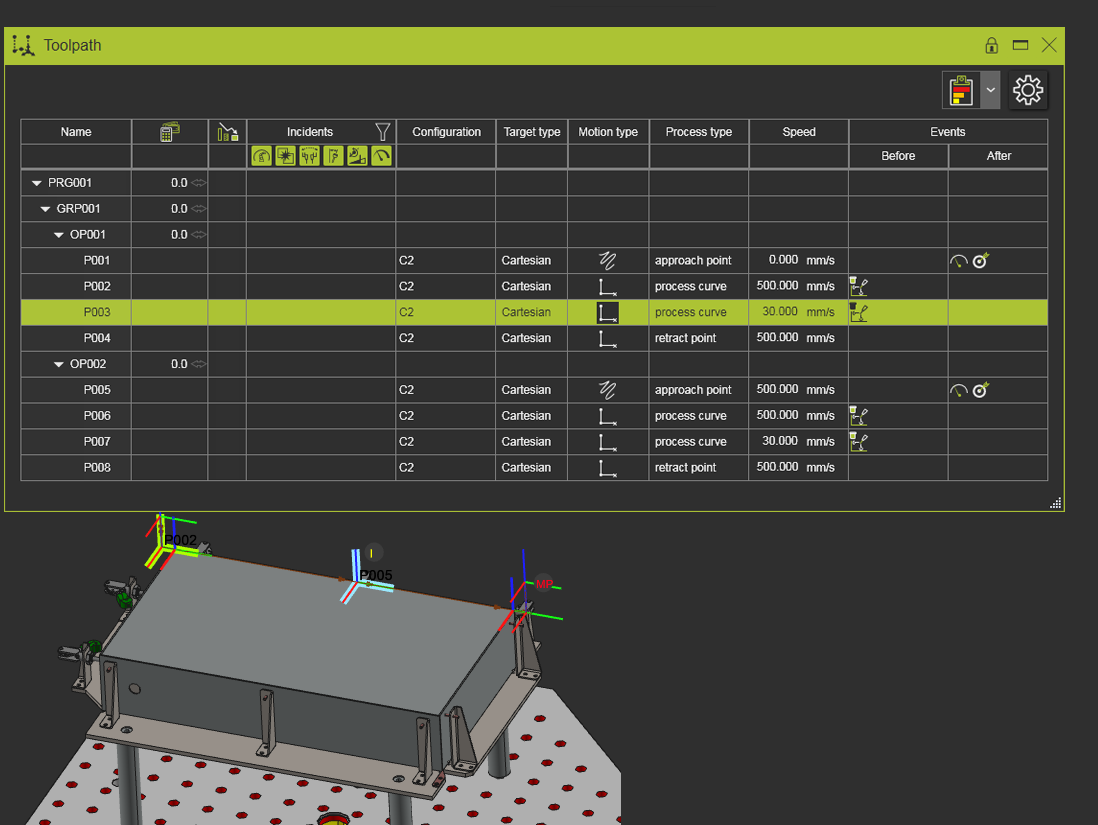
While simulating a program, the actual position of the tool along the toolpath is marked in this dashboard as well.
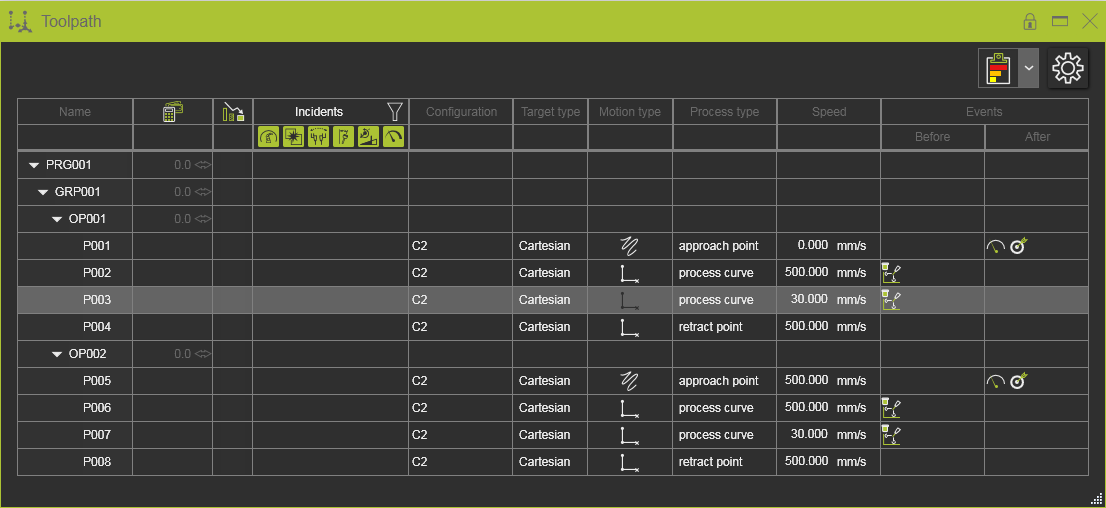
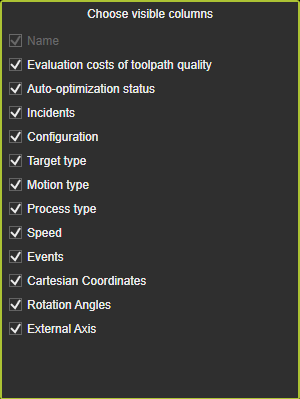
Table columns display option
The toolpath table includes several columns with certain information. To show all these columns the window may become too large to work with in relation with the 3D space. At the top right of the dashboard a settings command is placed.
![]()
The command opens a panel with all present columns listed. Each of them can be checked or unchecked to have it appearing in the table.
Toolpath quality evaluation display
At the top right of the dashboard the display settings for the toolpath quality evaluation are placed. With these settings is defined how the result of the quality evaluation is being visualized in the dashboard and in the 3D view.

The display options are made available also in other dashboards and the use of them is synchronized over these dashboards.
Toolpath quality costs evaluation
Each quality criteria has been given a costs function. The result is a numerical value, not some currency. In this column the calculated toolpath costs are being displayed.

Because each toolpath modification might impact the overall costs, a trend symbol indicates the costs change compared to its previous value.
| Value has been increased; i.e. higher costs effect | |
| Value remained the same; i.e. neutral or no effect | |
| Value has been decreased; i.e. lower costs effect |
Automatic toolpath quality optimization
![]()
Trying to improve the quality and its related costs indication level, some automatic optimization algorithms are available. The available commands to execute an automatic toolpath optimization can be found in the pie menu.

The toolpath table indicates the state of the optimization.
The column here indicates on which parts of the whole program the optimization process has been executed and what its status is.
| Empty; no automatic optimization has been run so far. | |
| The automatic optimization has been run and is still valid. | |
| The automatic optimization has been run, but is outdated (i.e. overrun) because of other (additional) modification. |
The effective result is shown in the costs and quality incidents columns and at the 3D toolpath itself.
In the column of the toolpath optimization a pie menu can be called.

Modifying toolpath positions
The pie menu can be opened at each individual toolpath position in the table. Multiple selection is also possible. The pie menu includes several edit commands.

Besides this, a complete operation, operation group or program can be modified, when calling the pie menu on these items in the table.

The pie menu includes some commands for quick expanding or collapsing the toolpath table rows.