Toolpath quality evaluation
![]()
Command
The toolpath quality evaluation is not a single command. It is an integrated solution that is executed in every step of a toolpath creation and modification action.
Activation
The evaluation itself is automatically executed. What criteria are taken into account while evaluating, that is defined in the Programming defaults or the Active program dashboard.
In the tech tab Toolpath quality, all available criteria for the currently applied technology are listed.
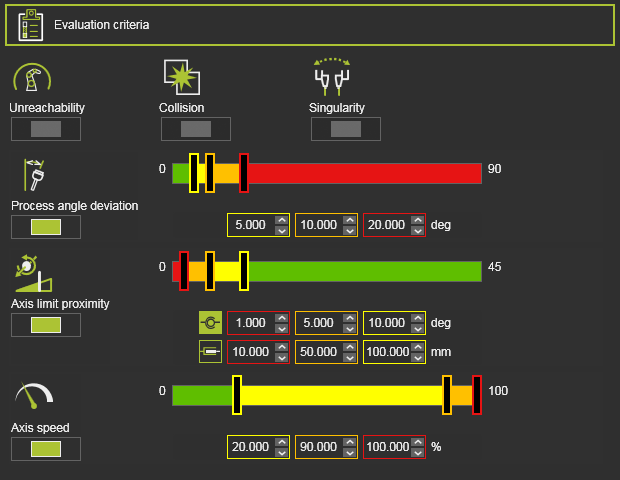
Each of them has a switch button to include the criteria in or exclude it from the evaluation. Simply pressing the button changes the state from include to exclude and vice verse. With one exception however. Some criteria might be activated by system default and cannot be turned off. The collision evaluation is activated over the analysis switch in the simulation player toolbar.
There are two sorts of criteria; the one that only returns a true or false value and the one that returns a measured or calculated value, which is then validated against a target quality range.
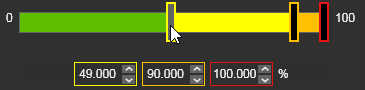
The total evaluation range has been divided in colored parts. Each color represents a specific quality level. The limit values of each range can be modified by either moving the color slider in the bar or by editing the values directly below the slider bar.
Incident feedback
The Active program and the Toolpath monitor dashboard show the result of the quality evaluation. All available criteria are present in the incident list.
![]()
The incident icon informs about the evaluation result of that specific criteria.
| Quality level | |
| Good (green) The value range of the criteria that is defined as good. There is no necessity to improve here. | |
| Acceptable (yellow) The value range of the criteria that is defined as acceptable. Although the result is acceptable, it is advised to improve here. | |
| Critical (orange) The value range of the criteria that is defined as critical. It is strongly recommended to modify, to improve the toolpath. | |
| Invalid (red) The value (and above) of the criteria that is defined as not acceptable. It is mandatory to modify, to improve the toolpath. | |
| Display | |
| Black Pressing the button switches the incident display on or off. When turned off, the button is black. | |
| Greyed out The criteria has not been evaluated. |
The evaluation is always executed on all individual toolpath positions of the whole program. Incidents can be of any quality level, obviously and multiple incidents can occur at the same position. This incident list here will always show the most severe quality of found results, from invalid (or failure) down to good.
![]()
On the incident button a pie menu can be opened.
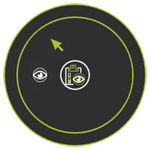
 Display the incidents of all criteria
 Display only the selected criteria's incidents
Quality display level
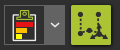
The quality level display is a selector to define which quality levels are being displayed. In other words; the toolpath elements, the operations, the operation groups and the program information will be colored according the results of the quality evaluation.

From the drop down list the preferred display level can be set.
| Display only the failure level. | |
| Display the failure and critical levels. | |
| Display all quality levels. |
Not displaying a quality level does not mean that incidents with that evaluated level do not exist!
Quality display in 3D
Incidents are usually displayed in the Active program and Toolpath monitor dashboards. With the option button at the right side of the display level, the incidents are also marked on the 3D toolpath.
The toolpath elements that have a quality incident, or multiple incidents, are colored with the highest level of found incidents.
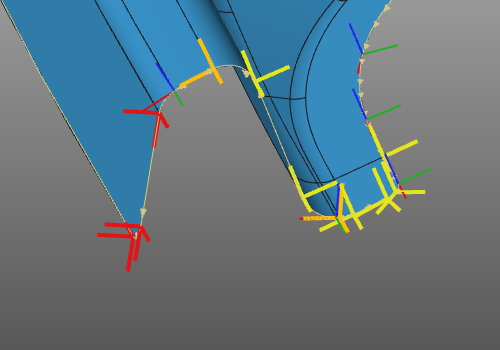
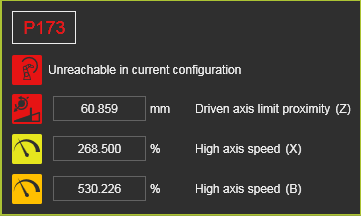
Hovering over an element opens a pop-up window with detail information about the incidents at that element.
![]()
The quality display on the 3D toolpath can also be turn on or off with the keyboard shortcut key
![]()
.
Quality display in the Active program dashboard
In the Active program dashboard the incident level is shown in the flow chart of the program.
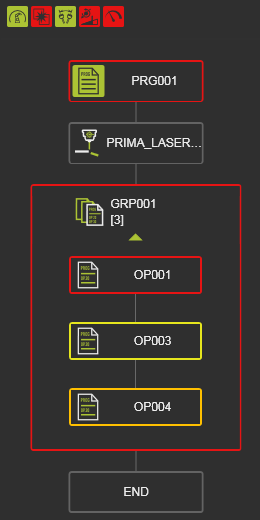
Because in this dashboard no toolpath elements are listed, the incident state is only visible on the operations, the operation groups and on the program. The quality at the individual toolpath positions cannot be analyzed here.
The indicated quality level is the highest found level collected from all the children.
For example; when just one toolpath position has a failure, its operation returns failure, the parent operation group returns failure and the program returns failure.
Quality display in the Toolpath monitor dashboard
In the Toolpath monitor dashboard the incident level is shown at each position of the toolpath. In case of incidents on a position, each incident is indicated by its symbol with evaluated quality level color and the position name is written in the highest found quality level color.
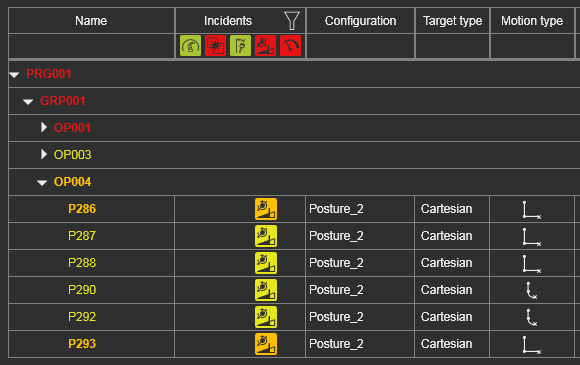
Hovering over an incident opens a pop-up window with detail information about the incident.
The incident table header includes a filtering option. Pressing the filter icon will hide all positions that do not meet the display level and incident display status.
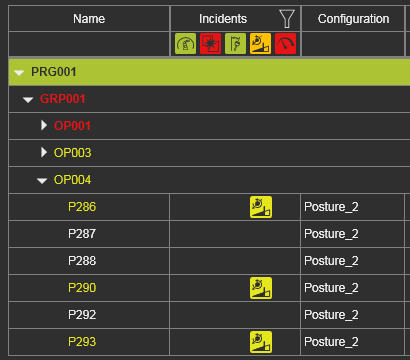 | 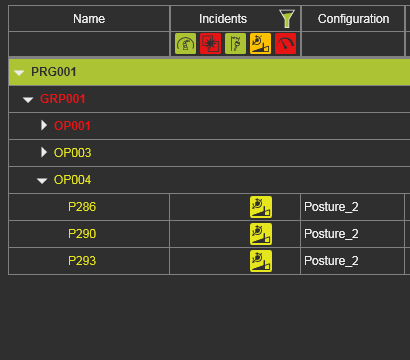 | |
| Unfiltered | Filtered |
Quality display on sub programs
Programs are evaluated with the criteria and values when the program is active. When including a program as a sub program in another main one, the evaluation remains calculated with these criteria definitions. In other words; a sub program will not be evaluated with the criteria and values of the active program in which it has been included. The evaluation results on the sub program call therefore may not match with the quality level display of the active main program.
Costs feedback
To be able to compare different toolpath situations or to optimize the toolpath, the quality of the toolpath is also being expressed in a costs factor. This is a neutral value, not any sort of currency.
At each toolpath position the costs are calculated for each analyzed criteria and then summed up. To avoid the influence of having different number of toolpath positions, depending on different kind of modifications, such as the approximation of the underlying geometry, each individual position costs is multiplied by the distance of the toolpath of that position. Finally, the total costs of an operation is the sum of its individual position costs. This is then done for each operation, each operation group and finally for the complete program.
The result is being displayed in the Toolpath monitor dashboard and is updated immediately after any modification of the toolpath.

Because each toolpath modification might impact the overall costs, a trend symbol indicates the costs change compared to its previous value.
| Value has been increased; i.e. higher costs effect | |
| Value remained the same; i.e. neutral or no effect | |
| Value has been decreased; i.e. lower costs effect |