Spray deposition process model
![]()
Spray deposition
Spray deposition or simply Deposition is the process model that calculates the deposition of a sprayed material, or other physical parameter, on a surface, for example like in painting.
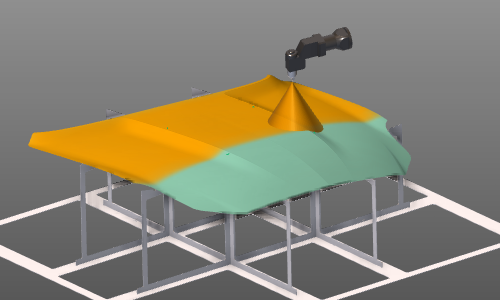
Process model object
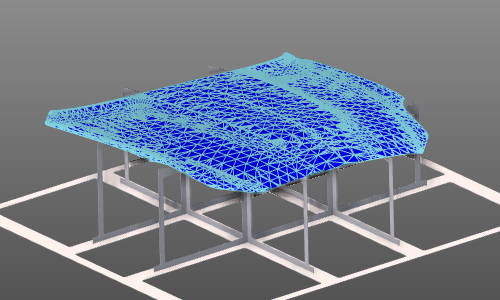
The process model calculates the impact on a surface. The process geometry object is a mesh based representation of that surface, built from nodes and triangular facets.
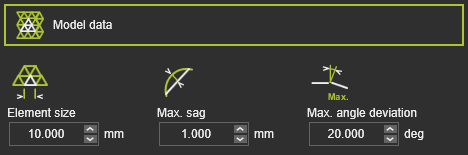
The mesh generator uses the following attributes:
| Attribute | Description | Remark |
|---|---|---|
| Element size | The maximum edge length of a mash element (facet). | The size may be different on each side of the element. |
| Max. sag | The maximum deviation from the associated input geometry. | Applies to both surface and boundary. |
| Max. angle deviation | The maximum angle between adjacent mesh elements. | Applies over the surface and along the boundary tangent. |
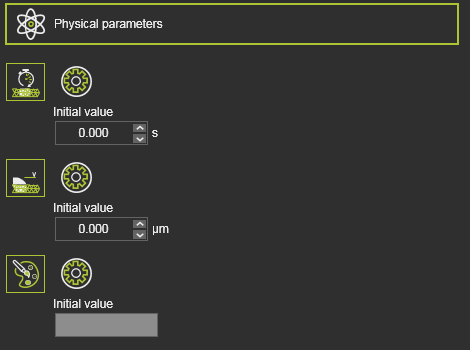
With this process model certain physical parameters can be analyzed, for which their initial value has to be set here. The initial value is being used when the process simulation starts from scratch.
| Physical parameter | Description | Remark |
|---|---|---|
| Spraying time | The impact time on the process geometry. | |
| Coating thickness | The layer thickness of the deposited material. | |
| Paint color | The real color of the deposited layer. | Pressing in the value field opens a color picker panel to specify the color value. |
Process data flow
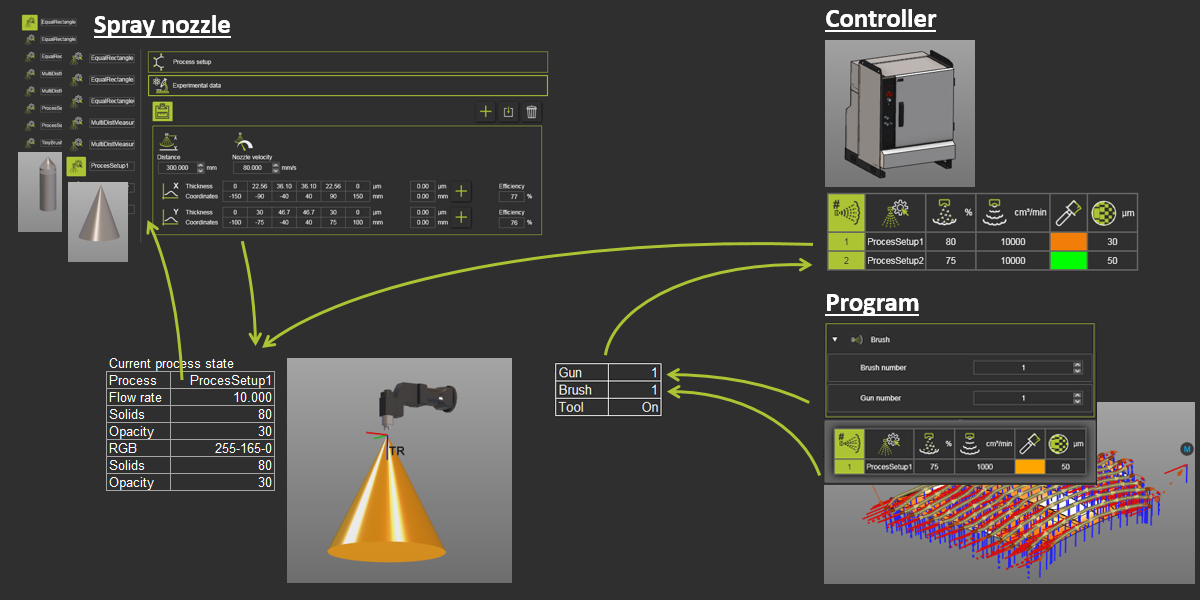
Controller process table
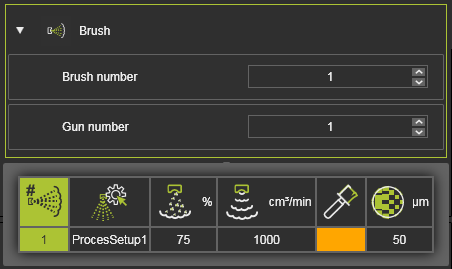
The actual spraying state, the operating conditions, of the spraying gun is called a brush profile, of which multiple can exist. The process table defines the brushes that can be used for the process simulation. Each brush refers to a spray pattern data set at the tool resource. The brush shape and dimensions, i.e. the spray cone, are generated from these experimental data in the tool behavior. The actual operation state of the brush is defined in this table.
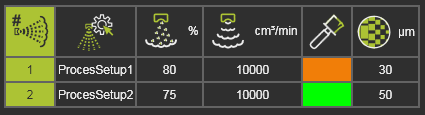
| Attribute | Description | Remark |
|---|---|---|
| Brush number | The brush number. | |
| Tool process behavior | The name of the tool process behavior. | The brush refers to the experimental data of that tool process behavior. |
| Volume solids | The percentage of spray material solids in the spraying fluid. | |
| Flow rate | The spraying volume flow. | |
| Brush color | The color of the spray material. | |
| Thickness for full opacity | The minimum layer thickness of the deposited material to gain full opacity of the material color. |
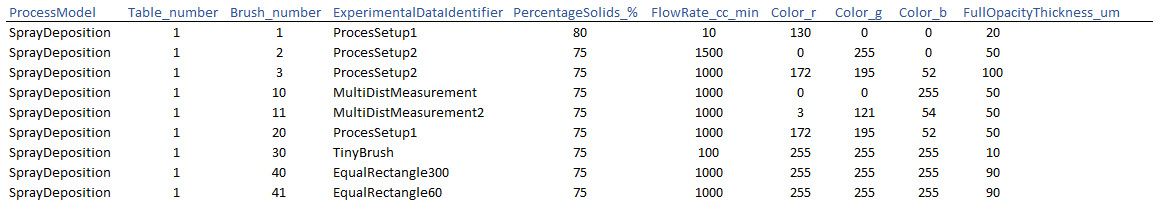
With the Add button, new brushes can be inserted in the list. The list will be ordered automatically according brush number. The brush number is unique; there cannot exist brushes with the same number. A brush can be removed with the pie menu on the specific brush row in the table.
The brush table can also be imported from an external .csv file, like the example below. Existing brushes will be overwritten while importing them.
Tool technology attributes
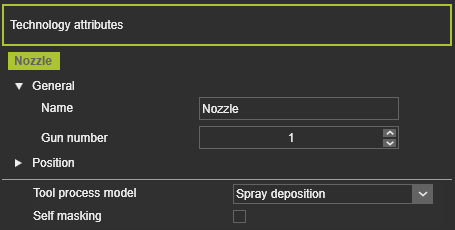
When the technology that includes the spray deposition simulation has been assigned to the tool resource, a technology reference frame will be created. This frame represents the origin of the brush. Its properties can be modified and its position can be fine-tuned when necessary. The frame is mandatory, so when it does not exist yet, it needs to be created upfront, otherwise the process simulation will not be executed.
The technology includes the attributes:
| Attribute | Description | Remark |
|---|---|---|
| Gun number | The allocated gun number of the technology frame. | A tool resource can have multiple guns (spraying outlets). |
| Tool process model | The available process models for the technology. | The content depends on the technology that has been assigned to the tool resource. |
| Self masking | Option to include the self masking effect during simulation. | When the tool would interfere with the spray cone during simulation, this masking effect will be calculated on the process geometry. |
Tool behavior data set
The tool behavior, the spray pattern coming from a brush is based on experimental data. This data is collected in a process setup, of which multiple can exist. Process setups can be created and edited here.
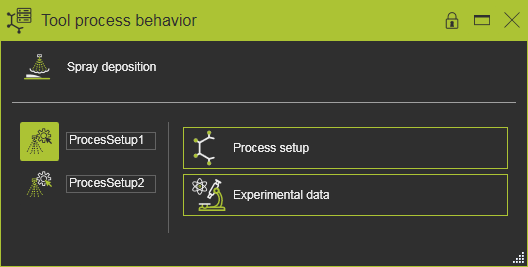
A process set has two containers with information.
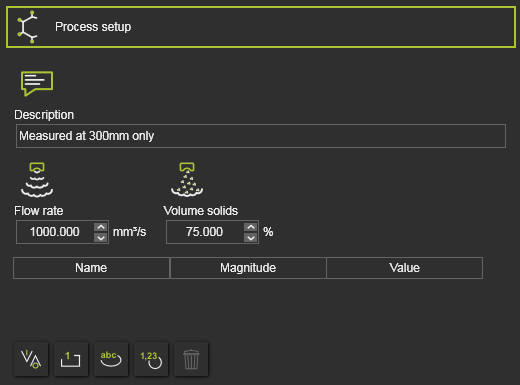
| Attribute | Description | Remark |
|---|---|---|
| Description | A short description of the process setup. | |
| Flow rate | The spraying volume flow applied during the experiment. | |
| Volume solids | The percentage of spray material solids in the spraying fluid applied during the experiment. |
This information can be extended with other attributes that will then appear in the table below these main attributes.
In the container Experimental data, the exact results of the experiments are located.
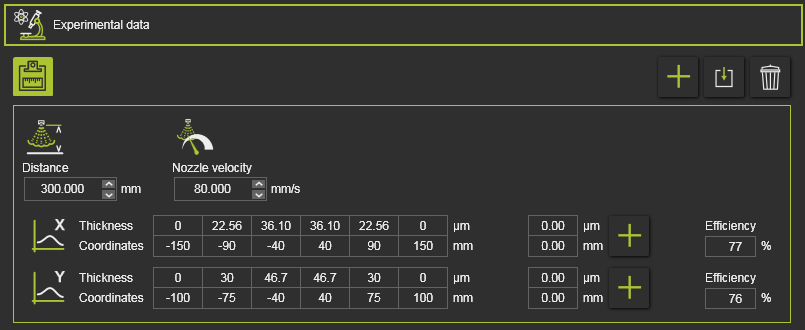
The experiment includes at least one spray profile, the description of the experiment and result.
| Attribute | Description | Remark |
|---|---|---|
| Distance | The distance of the spray nozzle to the target surface. | |
| Nozzle velocity | The velocity of the nozzle in the experiment. | |
| X- and Y-profile | The thickness values that are obtained from the spray experiment, measured in two perpendicular directions. |
The X- and Y-profiles of the experiment can be edited individually. With the Add button, new thickness positions can be a inserted. Existing ones can be removed with the pie menu at that position column. The profile however must be defined with increasing coordinate values, from a negative to positive range. The profile table will be reordered automatically over the coordinate row.
Both X- and Y-profiles are given an Efficiency rate. The efficiency describes how much of the spray material remains after deposition with respect to the total spray material output at the nozzle and not considering any spray air and solvents. Ideally, the X- and Y-profile efficiency values should be identical. When they are different it might be concluded that the defined experiment has not been performed consistently or that the measurement of the two resulting thickness profiles was inaccurate. A small difference in efficiency is marked with orange colored values, a mismatch with red colored values.
An experiment can be based upon multiple spray profiles. With the toolbar at the right side, new profiles can be added and existing ones can be modified or removed.
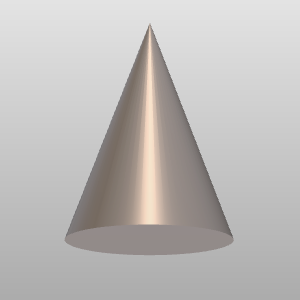
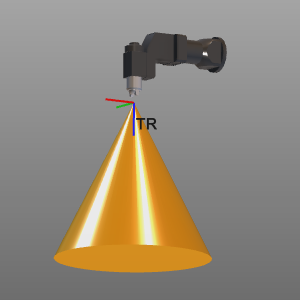
When working in the Resource Builder workbench, the spray cone belonging to the current selected tool behavior is being displayed in the 3D space. This is a nominal shape of the brush and might look different than the real brush that has been programmed and is being displayed during the simulation.
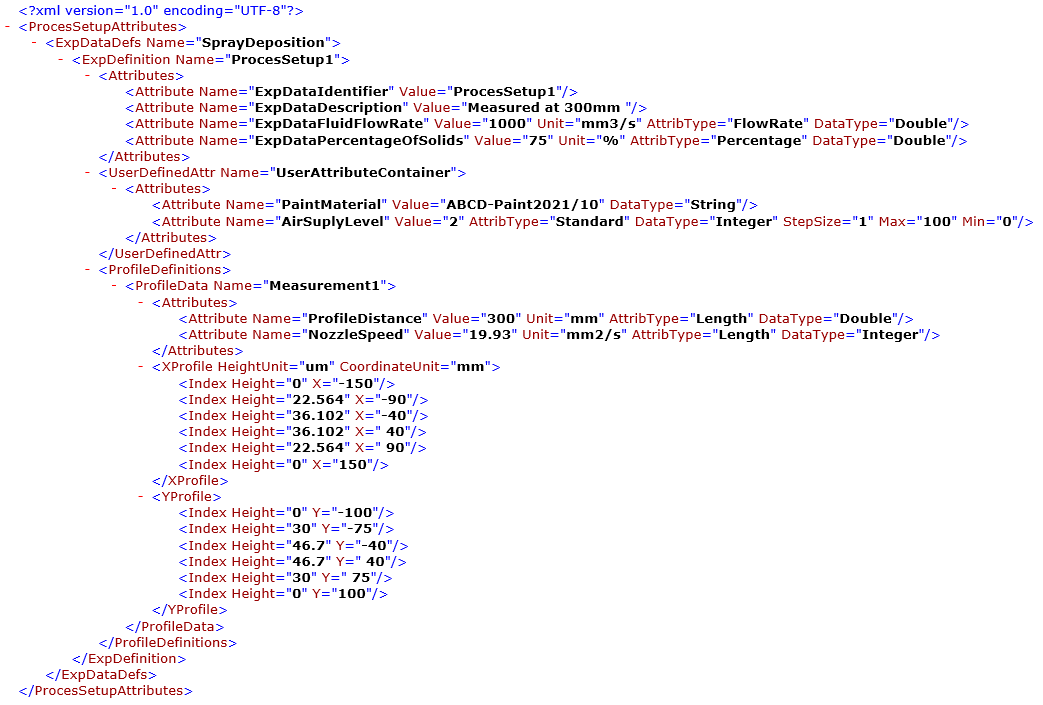
Besides creating the process setup information manually, it can be imported from external xml-based files. The format of the import file looks like the example below. Existing tables and content will be overwritten without any warning while importing them.
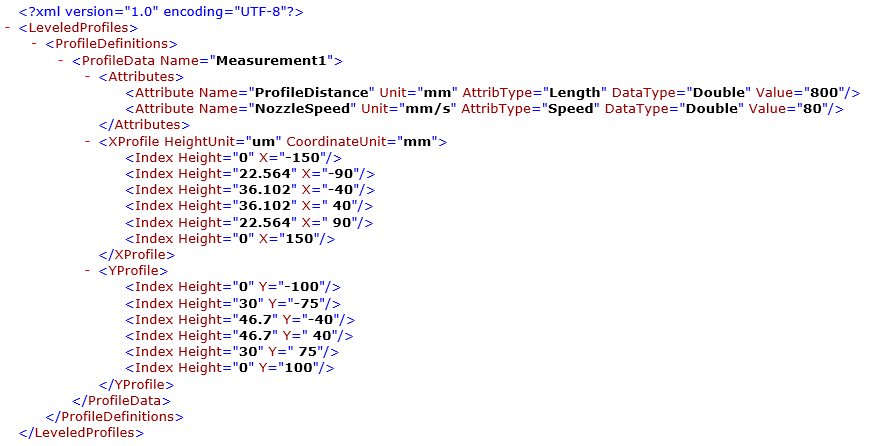
Measurement data profiles can also be imported individually. The xml-based files looks like the example below.
OLP events
In the OLP events it has been declared which gun (tool outlet) and which brush (outlet conditions) are applied along the toolpath. Hovering over the brush event will show the details of that brush as being defined in the controller process setup table.
Process imaging
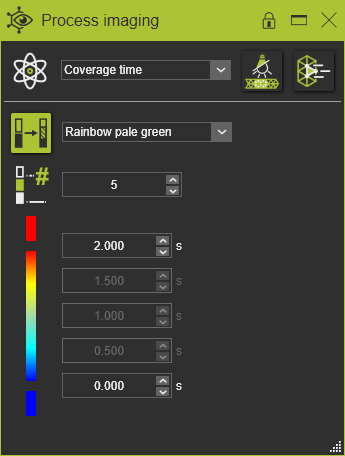
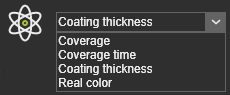
To see the results of the simulation, the desired physical parameter has to be set in the Process imaging dashboard. The dashboard might show parameters of other available process models too.
Each parameter can have appointed a different color scheme and range limits to display the results properly.